User Manual
This is the user manual of the `ndxtest` package. The repository is available on GitHub
Scope and Limitations
The ndxtest package seeks to make the backtesting of trading strategies accessible. In its current version (0.0.2) the package is quite specialized and in many ways limited:
Backtesting is performed on the basket of stocks included in the S&P 500 index. The necessary data is available in the packages GitHub repository.
ndxtest uses daily price data. Other timeframes are not implemented. This comes with a number of limitations as to what kind of trading strategies can be built with ndxtest.
The trades are entered/exited on the open of the day after signal completion. This is the only mode currently implemented. End of day will be implemented ASAP.
The codebase is currently not subject to systematic unit-testing. This will be implemented in coming versions.
Future versions of ndxtest aim to provide more generalized and thoroughly tested toolsets, while still trying to keep it simple for users.
Installation
Install Python version 3.9 or higher here.
Install a code editor of your choice. Google: ‘Python IDE’
Install git to easily download the required data from the repository.
Allow both Python and git to be added to the ``Path`` during their respective installations.
pip install ndxtest
ndxtest needs daily price data for companies included in the S&P 500. The data can be downloaded from the ndxtest GitHub repository. ndxtest comes with a set of tools that allows users to maintain and update their own copy to the data. More on that later, however, new versions of the data will be available every other month on the GitHub repository.
cd) to your favorite directory.git clone --depth 1 --filter=blob:none --sparse https://github.com/lksdnx/ndxtestcd ndxtestgit sparse-checkout set dataUpdating the Library
ndxtest.utils.LibManager will help with updating the library.Create a new .py file in your code editor and
from ndxtest.utils import LibManager
lm = LibManager('C:\\Users\\user\\absolute\\location\\of\\data')
This will raise errors if the required directories and contents are not found in the path.
As of now, the updating process is not fully automated. The process involves three steps:
Checking for S&P index announcements on www.spglobal.com.
Updating data\lib\^HIST.xlsx (the histfile).
Running the update. Takes about 5 min., during which you need to sit in front of the screen because user input may be required.
The index announcements given on spglobal.com will include index additions/removals and mergers/spinoffs.
Warning
Ticker symbol name changes can occur as well. Most times, these are not announced by spglobal.
Lets say that since the last update ‘FOO’ replaced ‘BAR’ in the index, ‘BAZ’ had a rebranding and is now trading under ticker symbol ‘QUX’ and ‘JE’ acquired (the S&P 500 listed company) ‘EZ’ and is now trading under ticker symbol ‘JEEZ’. The following would do the job (do not actually paste this):
lm.histfile_new_entry('add', 'FOO', '2022-06-06')lm.histfile_new_entry('remove', 'BAR', '2022-06-06')lm.lib_rename_symbol('BAZ', 'QUX')lm.histfile_new_entry('remove', 'JE', '2022-06-23')lm.histfile_new_entry('remove', 'EZ', '2022-06-23')lm.histfile_new_entry('add', 'JEEZ', '2022-06-23')LibManager.lib_update.lib_rename_symbol() renames the symbol in the histfile as well as the .csv file
in the lib directory. Now we can run the update of the library using LibManager.lib_update().
Set the new new_entries parameter to the number of new entries that have been added to the histfile
since the last update. If the last update was more than 3 months ago, set the period parameter to ‘6mo’ or ‘1y’, respectively.
lm.update_lib(period='3mo', new_entries=5)
The updating function uses the very nice yfinance package. Yfinance provides an interface to the finance.yahoo.com API, from which daily price data can be downloaded for free.
First, a backup data\lib_backup_YYYY-MM-DD is created. Then, update_lib appends new records to all active symbols in data\lib. By default, 5 years worth of daily price data will be downloaded if a .csv file is not yet present. A delay of .3 sec per request prevents the API from limiting user access, however, it slows down the process. The data provided by finance.yahoo includes stock splits, which are automatically processed in the already present .csv files.
Warning
If you read the following in your console: ‘Error processing FB… (symbol may be delisted or a name change may have occurred).’
Go to Google and find out whether FB maybe had a name change. Continue the current update. If a name change has occurred run:
lm.lib_rename_symbol('FB', 'META'), then run lm.update_lib(period='3mo', symbols='META') to update ‘META’ and ignore
all other symbols.
Note
If LibManager.update_lib encounters situations it does not know how to handle it will request Y/N user input. For the 5 minutes the update will take you should watch the screen from time to time.
Note
If you have the feeling that something went wrong in the process you can delete the lib folder and rename the backup folder to lib.
Warning
It is recommended to update the library at least once every one to two months, otherwise one risks data becoming inaccessible. Especially, finance.yahoo will delist acquired companies some time after the transaction. Any missing price data for the acquired company before the transaction took place then becomes inaccessible for download.
Building a Strategy
A script (tutorial.py) containing all the lines of code hereafter exists in the docs of the repo.
Now that the data is up to date we can build a first strategy. Strategies are built using ndxtest.utils.Strategy
as well as some of the indicator functions found in ndxtest.indicators. An instantiated Strategy object has to
be fed with sets of conditions for 4 things:
conditions for entering long positions >> Strategy.enter_long_if
conditions for exiting long positions >> Strategy.exit_long_if
conditions for entering short positions >> Strategy.enter_short_if
conditions for exiting short positions >> Strategy.exit_short_if
All of the 4 condition sets can include arbitrary numbers of elementary conditions
All elementary conditions have to be True to generate a signal.
An elementary condition consists of three parameters: day, condition, use_index, where…
day is the day on which the condition must be true. -1 is one day before signal completion. 0 is the day of signal completion. Positions are opened on the open of day +1.
condition is the condition. In most cases represented by one or several indicator functions wrapped by a lambda function.
use_index is either
TrueorFalse. By default, it isFalseand can be omitted. If the parameter is set toTruethe strategy will check if the condition is True for the S&P500 index, not for the individual stock.
For a list of indicators currently available refer to the technical documentation of indicators.py. For the first example strategy here, we will use the relative strength index rsi the simple moving average sma and the crossover function. However, we will import all indicators for now.
from ndxtest.backtest import Strategyfrom ndxtest.indicators import *s1 = Strategy()s1.enter_long_if(0, lambda x: crossover(50, rsi(x), 'bullish'))s1.enter_long_if(0, lambda x: x.close > sma(x, 20))s1.exit_long_if(0, lambda x: crossover(sma(x, 20), x.close, 'bearish'))This translates into: - Buy when the RSI rises above 50 and at the same time the closing price is higher than the 20 period SMA. - Sell when the price closes beneath the 20 Period SMA.
The variable x refers to a pd.DataFrame containing ohlc data of an individual stock or of the index, respectively.
You can use: x.open, x.high, x.low, x.close and x.volume.
This simple strategy generates lots of signals. With a universe of 500 stocks, you will fully invested for most of the time.
Note
Take care not to combine mutually exclusive elementary conditions or you will end up with no signals.
Running the Backtest
Lets have a look at the results of s1.
bt1 = BackTest('C:\\Users\\user\\absolute\\location\\of\\data')bt1.import_data(start_date='2019-06-01', end_date='2020-06-01', lag=200)Note
Upon initialization of a BackTest instance, a timestamped (YYYY-MM-DD_HH-MM-SS) output folder is created in the data\ directory.
Note
In the example above, lag=200 tells the BackTest instance to import an additional 200 days of price data preceding the start_date. This is needed for proper calculation of lagging indicators such as moving averages. If your strategy uses indicators that lag more than 200 days, e.g. a 300 day moving average, you need to increase the lag, respectively. 200 is the default, so in most cases the lag parameter can be omitted.
The chosen time period includes the corona crash. Lets see how our strategy performs.
bt.generate_signals(s1)bt.run_backtest()bt.report()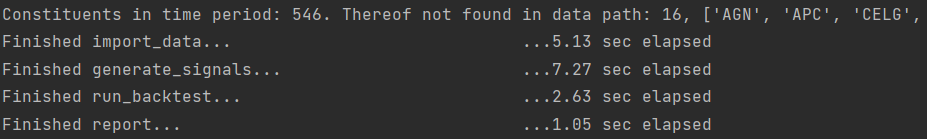
Note
run_backtest() has a number of parameters, all of which have default values. For example, you can increase
the maximum number of positions in your portfolio. Please refer the technical documentation.
The output folder now contains backtest_report.pdf, equity_curve.csv and tradelog.csv. equity_curve.csv contains the ohlc absolute market value development of the portfolio during the backtest. A plot of the relative development compared to the index is shown in the backtest_report.pdf. tradelog.csv is a log of all trades taken during the backtest.
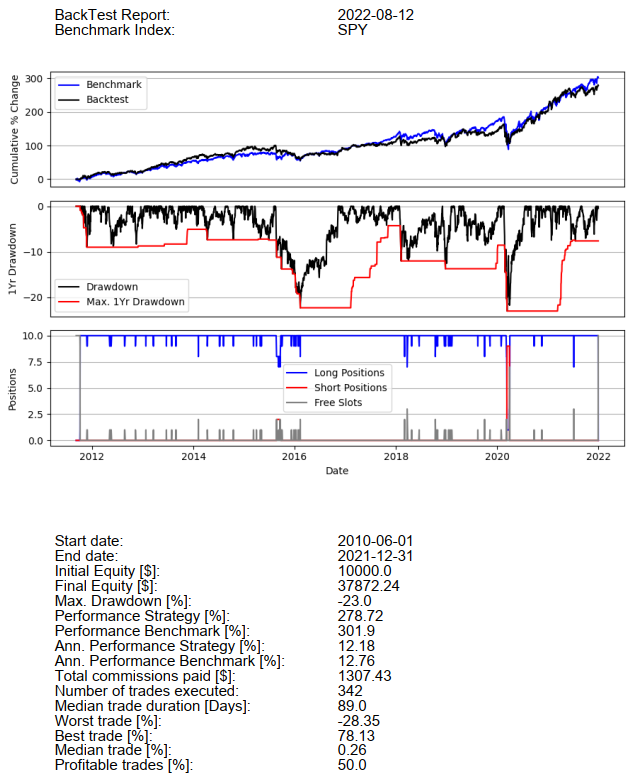
The backtest_report should look like this:
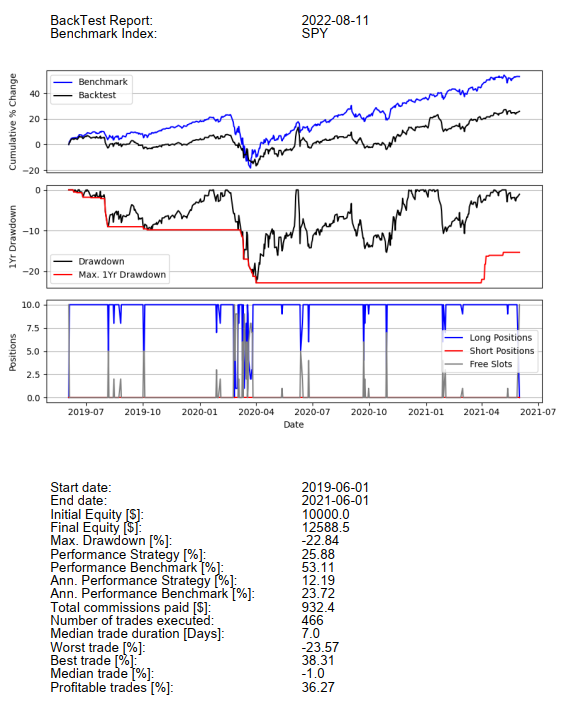
We do have a small profit but we dramatically underperformed the index. Before we try to improve on this, lets talk about a few technical details.
Some strategies frequently produce a lot of signals on one day, while producing little or no signals on most other days. At the moment, a mechanism for ranking the signals so that from lets say 20 signals the best ones measured by some metric are taken first, is not implemented. This will be one of the first new features in upcoming versions of ndxtest. At the moment, the signals are taken alphabetically. Lets say the portfolio has only two slots left but there are buy signals for ‘AAPL’, ‘META’ and ‘GOOG’. Positions in ‘AAPL’ and ‘GOOG’ but not ‘META’ will be initiated.
If a long position in a given symbol already exists, new long entry signals for this symbol will be ignored and vice versa.
If a short entry signal for a given symbol occurs but there already exists a long position in this symbol, no short position will be opened. This is a design choice. A more aggressive way would be to close the existing long position and at the same time open a new short position. The optionality may be implemented in future releases.
The same applies vice versa. A new long entry signal will not open a new long position if a short position in the same symbol already exists.
Also read about the max_trade_duration and stoploss parameters of the run_backtest() class method. They both represent additional methods to close positions irrespective of the signals provided by the strategy.
Now lets try to improve on s1 and build s2:
s2 = Strategy()s2.enter_long_if(0, lambda x: crossover(50, rsi(x), 'bullish'))s2.enter_long_if(0, lambda x: x.close > sma(x, 20))s2.enter_long_if(1, lambda x: x.open > prev(x.close))s2.exit_long_if(0, lambda x: crossover(sma(x, 70), sma(x, 20), 'bearish'))s2.enter_short_if(0, lambda x: crossover(40, rsi(x), 'bearish'))s2.enter_short_if(0, lambda x: roc(x, 5) < -0.08, True)s2.exit_short_if(0, lambda x: roc(x, 10) > 0.1, True)Translating into: - Enter long when the RSI bullishly crosses the 50 level and at the same time the closing price is higher than the 20 period SMA. - Additionally, at the day of initiating the position (1), the opening price must be higher than the previous closing price. - Close long positions when 20 period SMA bearishly crosses the 70 period SMA. (more slack than s1) - Enter short if the RSI bearishly crosses the 40 level and at the same time the index (True) has lost 8% or more in the last 5 days. - Cover short positions if the index has risen by 10% or more within the last 10 days.
Now we could do bt1.generate_signals(s2) but we use a new instance of
ndxtest.backtest.BackTest in order to get a new output directory:
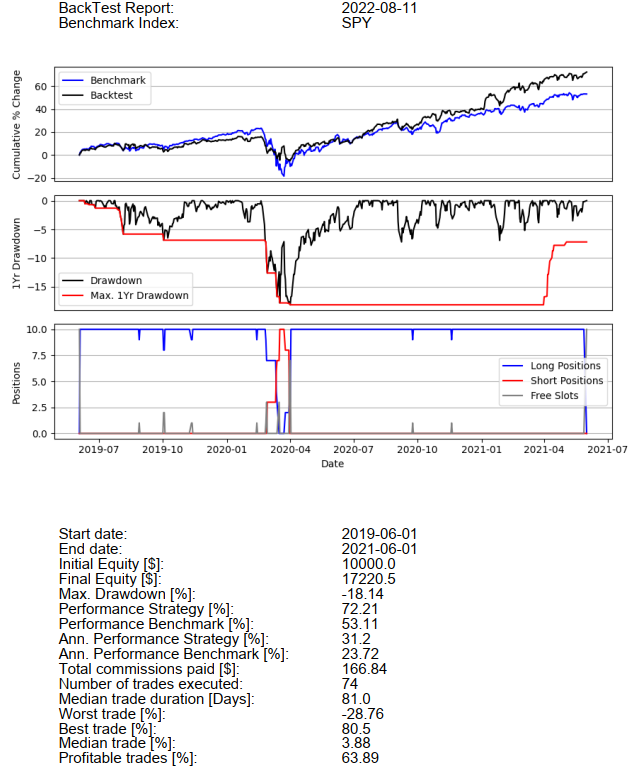
bt2 = BackTest('C:\\Users\\lukas\\PycharmProjects\\spy\\data')bt2.import_data(start_date='2019-06-01', end_date='2021-06-01')bt2.generate_signals(s2)bt2.run_backtest(stoploss=0.10)bt2.report()Note
Note that this time we are also using a stoploss of 10%. The stop loss threshold is always relative to the entry price. A trailing stoploss is not implemented yet. Stop loss signals are generated on the open and are directly executed before any other signals generated by the strategy are considered
The result looks like this:
Lets see how the same strategy performs on a much longer time period:
bt3 = BackTest('C:\\Users\\lukas\\PycharmProjects\\spy\\data')bt3.import_data(start_date='2010-01-01', end_date='2021-12-31')bt3.generate_signals(s2)bt3.run_backtest(stoploss=0.10)bt3.report()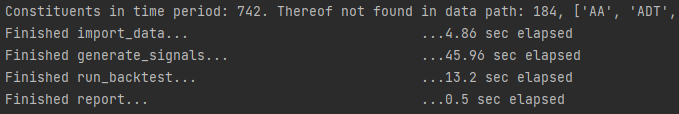
The strategy did not beat the index even though there was significant survivorship bias at play. Of 742 symbols that were included in the index during the time period, 184 were not present in the library. With these results, buying an ETF on the index would definitely have been the better and easier choice. The truth is, finding a strategy that beats the S&P 500 index - especially with the tools at hand here - is very hard.
More Examples and Remarks
Before concluding this manual/tutorial, here are some more examples of and remarks on what can be done using the indicators and functions provided in ndxtest.indicators.
prev() provides useful syntactic sugar to compare the current with the previous candle.
prev(x.close) is equivalent to x.close.shift(1) but it reads much better when writing conditions:
lambda x: x.close > prev(x.close) for example can be used in many ways using other operators and other datapoints such as x.low or x.high
Some specific candlesticks have corresponding functions in ndxtest.indicators (see Technical Documentation).
s = Strategy()s.enter_long_if(-2, green_candle)s.enter_long_if(-1, green_candle)s.enter_long_if(0, bullish_pin_bar)s.enter_long_if(1, x.open > prev(x.close))Generates long entry signals if a two green candles are followed by a bullish pin bar AND on the day of position initiation (1) the opening price is higher than the previous close.
Note
You can enter arbitrary positive numbers, however, signals complete with day 0 and positions are initiated at day 1. If anything, only conditions concerning the open of the day of position initiation (1) make sense. Anything beyond that would require knowledge of the future.
There are two indicator functions: the bollinger bands (bbands) and the moving average convergence divergence (macd)
that output a tuple of pd.Series instead of one pd.Series. Please refer to the technical documentation
before using these indicators. For example bbands(x)[0] would access a 20 period SMA (standard for bollinger band calculation), while
bbands(x)[1] would access the lower and bbands(x)[2] would access the upper bollinger band.
s.enter_long_if(0, lambda x: x.closes > bbands(x)[2])
Translates to: Enter long when the price closes above the upper bollinger band of the 20 period SMA.